Hai there,
if you are a Web developer, designer who work on web sites, this tools is very good for you.
this tools is very usefull for us on test and tweak your web script code..
Firebug integrates with Firefox to put a wealth of web development tools at your fingertips while you browse. You can edit, debug, and monitor CSS, HTML, and JavaScript live in any web page.
Just the way you like it
Firebug is always just a keystroke away, but it never gets in your way. You can open Firebug in a separate window, or as a bar at the bottom of your browser. Firebug also gives you fine-grained control over which websites you want to enable it for…
F12 is your friend
The F12 key is undoubtedly the fastest way to get to Firebug. Train yourself to hit that key when it’s time to go debugging. If you’re the big screen type, use Control+F12 (or Command+F12 on Mac) to open Firebug in a separate window.
Inspect and edit HTML
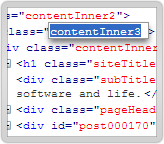
 Firebug makes it simple to find HTML elements buried deep in the page. Once you’ve found what you’re looking for, Firebug gives you a wealth of information, and lets you edit the HTML live.
View source live
Firefox has a “View Source” window, but it doesn’t show you what the HTML source really looks like once it has been transformed by JavaScript. Firebug’s HTML tab shows you what the HTML looks like right now.
In addition, the tabs on the right side let you discover the properties of an individual element, including the CSS rules that are styling it, the pixels that define its position and size, and the DOM properties that you can access from JavaScript.
See changes highlighted
 In any JavaScript-driven website, HTML elements are constantly being created, removed, and modified. Wouldn’t it be nice if you could see exactly what, when, and where these changes take place?
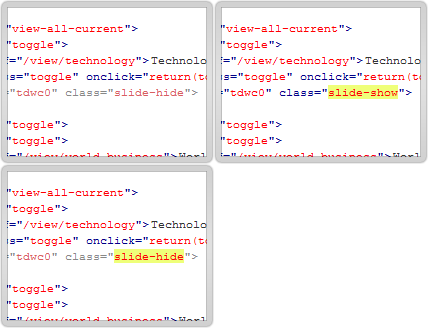
Firebug highlights changes to the HTML in yellow immediately when they occur. If you want to spy even closer, you have the option to also scroll every change into view, so you won’t miss a thing.
Find elements with the mouse
 Something in your page doesn’t quite look right and you want to know why. There’s no faster way to get answers than to click the “Inspect” button on Firebug’s toolbar and then prepare for immediate gratification. As you move around the page, whatever is beneath your mouse will be instantly revealed within Firebug, showing you the HTML and CSS behind it.
Monitor network activity
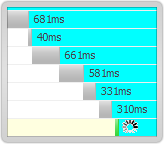
 Your pages are taking a long time to load, but why? Did you go crazy and write too much JavaScript? Did you forget to compress your images? Are your ad partner’s servers taking a siesta? Firebug breaks it all down for you file-by-file.
Debug and profile JavaScript
Firebug includes a powerful JavaScript debugger that lets you pause execution at any time and have look at the state of the world. If your code is a little sluggish, use the JavaScript profiler to measure performance and find bottlenecks fast.
Quickly find errors
When things go wrong, Firebug lets you know immediately and gives you detailed and useful information about errors in JavaScript, CSS, and XML.
Explore the DOM
The Document Object Model is a great big hierarchy of objects and functions just waiting to be tickled by JavaScript. Firebug helps you find DOM objects quickly and then edit them on the fly.


